BOBCharts
Button
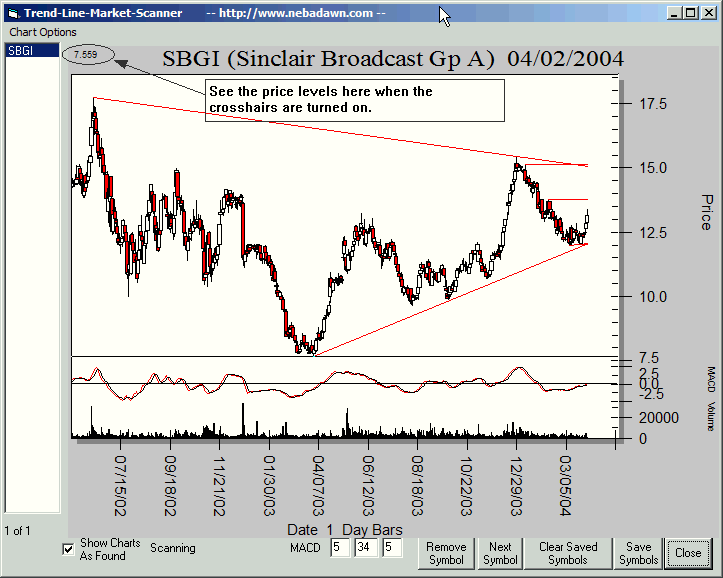
This will generate fully automatic trend lines on any chart. This feature was
added in Ramp 5.2 and allows you to view the closest three support and resistance
lines on any chart. The system looks back over 1000 bars to be sure and pick
up major trend lines that you normally might miss. You can click on a symbol
in the input symbol list and it will appear in the text box as does SBGI in
the example below. Then just press the BOBCharts button and a chart with automatic
trend lines will pop up.
If you leave the text box blank and click on the BOBCharts button, the program
will generate automatic BOBCharts for every symbol in the input list. This is
an excellent way to tab through your portfolio or to tab through the sectors.
You will see instantaneous support and resistance lines for each symbol. Turn
on your cross hairs to zero in on price levels for each line. A sample BOBChart
is shown below.
You can go to the "Advanced" button and adjust the number of support and resistance lines shown. You can also adjust the Swing Size to filter out small moves. See the "Advanced" setting button to access these features.
![]()
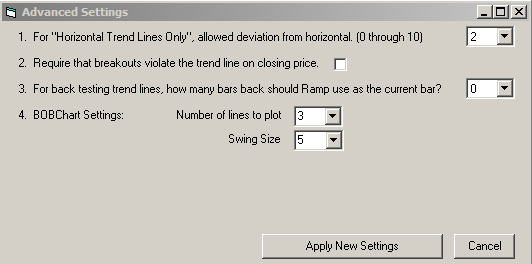
4. BOBChart Settings.
(Number of Lines) You can choose from 1 to 4 lines for BOBCharts. As an example, if you select 3 lines, the BOBCharts will show you the closest 3 support lines and the closest 3 resistance lines for a total of six lines.
(Swing Size) Think of the swing size as a noise filter. To filter out the small moves that cause very close support and resistance levels you can adjust this number. A value of 1 will have very close support and resistance lines. Most traders will want to choose a larger value. You can choose values from 1 to 10. 5 is the default value and a good value for swing trading.
---- Home ---- Back to MetaStock, TC2000 and TCNet Trend Line Scanner Home Page