Ramp Chart Pattern
Recognition Scanner
Fibonacci Market Scanner
Release 1.0
Instruction Manual
To Load the Fibonacci Market Scanner on Your Computer,
·
If you have previously
installed The Fibonacci Market Scanner, you must uninstall the old version
before installing the new one. To do this, go to the control panel and click on
the add/remove programs icon. Scroll down through the list of installed programs
and find “The Fibonacci Market Scanner”. If it is there, highlight it and
click on the “add/remove” programs button. If you are prompted, asking if
you are sure you want to remove shared components, answer “no” to each or
“no to all”. Leaving a few shared files and the old Fibonacci Market Scanner
directory is OK. They will be reused and brought up to date during the new
install.
·
Make sure that no
programs are currently running on your computer.
·
If you have downloaded
the Fibonacci Market Scanner program from the Web, it will usually begin the
installation automatically. If the installation does not start automatically
double click on the downloaded Fibonacci Market Scanner installation file.
·
If you have an
original Fibonacci Market Scanner CD run the “setup” program on the
Fibonacci Market Scanner CD.
·
If you are unsure how
to run the setup program on the CD, do the following: Insert the Fibonacci
Market Scanner software distribution CD. The setup program on the CD may
automatically start when you close the CD drive. If it does not, click on the
“Start” button at the lower left of your screen. Then select “Run”. A
pop up window will appear that will allow you to find the programs on your CD
drive. Click the “Browse” button. Your CD drive will most likely be drive
D:\ or E:\. Select it and then find the program named “setup”. Select this
program and click on OK. Click OK again to run the program.
·
Follow the
instructions in the setup program. It will guide you through setting up the
Fibonacci Market Scanner program.
·
After the installation
is complete, you will probably want to place an icon on your desktop to make
running the program very simple. To do this, simply go to the programs menu and
find The Fibonacci Market Scanner. Click on the Fibonacci Market Scanner with
your right mouse button and select “copy”. Then, using the mouse, place your
pointer anywhere on your desktop of icons and push the right mouse button again.
This time select “paste shortcut”. A shortcut icon to the Fibonacci Market
Scanner will be placed on your desktop.
·
You are now ready to
run the Fibonacci Market Scanner program.
Should I scan all stocks in my database?
The Fibonacci Market Scanner runs much faster when you use tools provided by your data vendor to narrow down your search to the stocks you would be willing to invest in. Of the 9000 plus stocks available, most traders would only consider a small portion as tradable. Use your data vendor’s tools to build a list with your acceptable technical parameters. An example might be all stocks with volume over 50,000 shares traded yesterday. Don’t be concerned if there are over 1000 to 2000 stocks in the list. the Fibonacci Market Scanner will make fast work of finding the chart pattern you ask for.
Pull down the “Password” menu item.
![]()
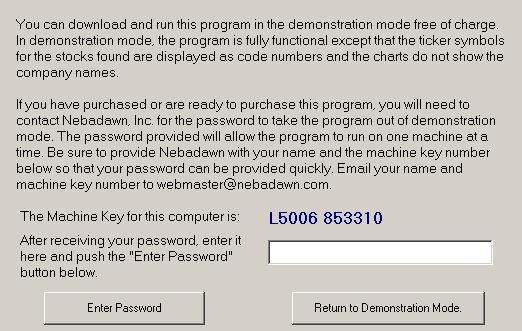
Instructions for entering a password and getting The Fibonacci Market Scanner out of Demonstration mode are located on the password screen shown in figure #1 below:
Connecting to
Data Files
Pull down the “File”
menu item and select “Input Data Format”.
Then select your data format as shown in Figure #2 below.
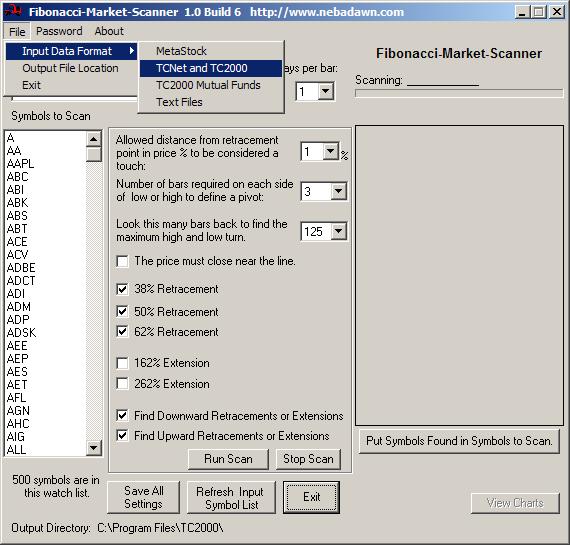
Figure
#2 … Selecting
the Historical Data Format
Select
MetaStock from the menu and a window will pop up that will allow you to select
the disk drive and folder containing your MetaStock data files. See figure #3.
Note that there is a check box to instruct The Fibonacci Market Scanner to also
scan all data found in the subdirectories (folders) one level down from the
selected folder. When you choose to do this, you can have The Fibonacci Market
Scanner scan multiple folders in a single scan. There does not need to be any
MetaStock data in the top folder. The Fibonacci Market Scanner will
automatically search the selected folder and sub folders for valid MetaStock
data. Note that The Fibonacci Market Scanner will only scan folders one level
below the selected folder.
You
can arrange your MetaStock data files in such a way as to scan all files you
want to scan in a single The Fibonacci Market Scanner scan. After you have
selected the MetaStock folder you wish to scan, click on “OK” and The
Fibonacci Market Scanner will retrieve the requested MetaStock data. Be sure and
press the “Save All Settings” button on the main screen to save your default
MetaStock data file settings.
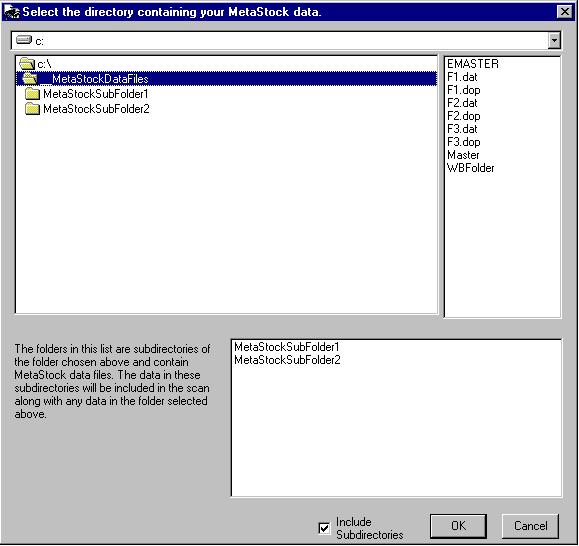
Figure
#3 … MetaStock Folder Selection Window
TC2000 Data File Selection:
Select TC2000 from “Input Data Format” under “File” as shown in figure #1. The current default TC2000 Watch List will appear in the “Select a Watch List” pull down combo box as shown in figure #4. This pull down combo box will contain your entire current collection of TC2000 watch lists. Select from the drop down list the watch lists of stocks that you would like to have scanned for possible trend line touches as of your last TC2000 download. You may want to keep a special TC2000 Watch List active for just this purpose. For instance, you may have a list of all of the S&P-500, Dow-30, and NASDAQ 100 stocks combined in a single list that you name “Send to THE FIBONACCI MARKET SCANNER”. Be sure and press the “Save All Settings” button on the main screen to save your default TC2000 Watch List selection.
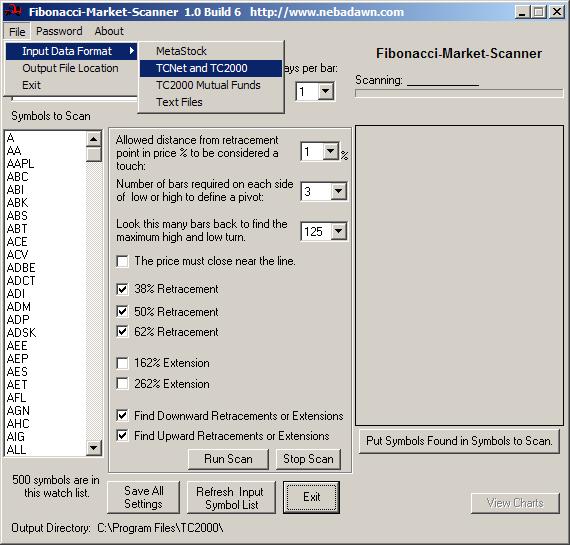
Figure #4 … TC2000 Watch List Selection
Text Data
File Selection:
The
Fibonacci Market Scanner will read historical stock data from text files. The
data is comprises of a separate file for each security. The file’s name is the
securities ticker symbol and each file contains at least 90 days of historical
end of day data. Each line of the file is a record for one day’s data. The
required fields are Date, Open, High, Low, Close and Volume. Other data may be
present on the line but will not be used by the The Fibonacci Market Scanner
program. When you select “Text Files” (see figure #1) from the “File”
pull down menu a window will pop up as shown in figure #5.
You can select the directory where the text files are stored. The file names
will appear in the “Files” window and the first five lines of data will be
displayed in the sample data window. You can fill in each option to match the
format of your particular text data files. When you have finished, select the
“Open Data Files “ button and your text file data will be retrieved. Be
sure and press the “Save All Settings” button on the main screen to save
your default Text data file settings.
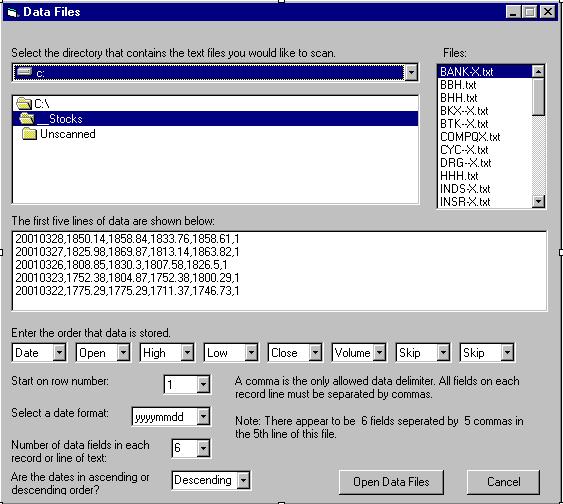
Figure #5 … Text File Settings
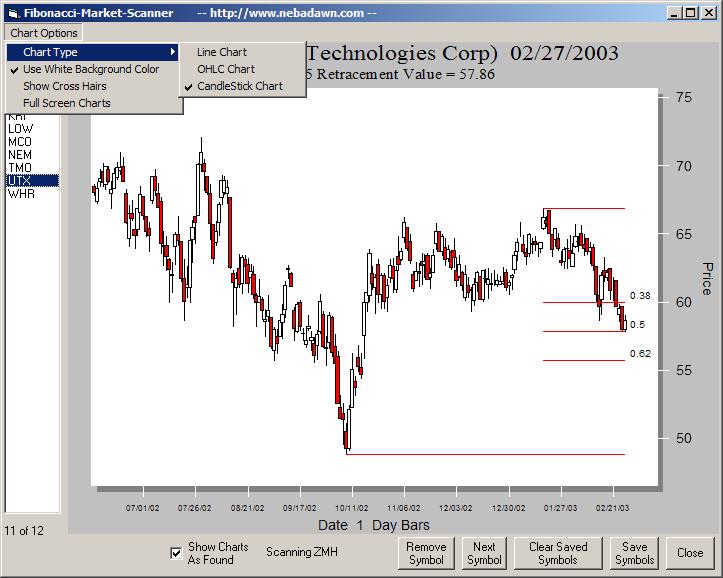
Special
Note:
The Fibonacci Market Scanner finds
stocks that have touched arithmetic retracement lines. To properly view the
charts in charting programs other than The Fibonacci Market Scanner, you must
set the price scale to arithmetic.
For
TC2000 users you can set a arithmetic scale by a right mouse click on the price
graph, then select Indicator Tab, Scaling, Arithmetic and then Close. The price
graph for this tab will now properly display the charts.

Days Per Bar
You can set the number of days to be represented by a single bar. As an example, you can set this value to 5 and scan weekly charts. This will allow you to scan for very long-term Fibonacci line touches.
You
can adjust how close the price (in percent of stock price) must be to a
Fibonacci line to be considered a touch. The default value is 1%. You can change
this value if you want to make the scan more or less rigorous. If in doubt, just
use the 1% default value.
Run
Scan Button
Push this button and the scan will begin. The program will show the ticker symbols for the stocks as it runs, allowing you to keep track of the progress. When finished, a window will pop up that says “Scan Finished”. Click OK to close this window. You are now ready to view the charts returned.
Stop
Scan Button
The Stop Scan button will abort the scan in process. You can press this button any time you wish to stop a running scan. To restart the scan you will have to restart the scan from the beginning.
Use the
“Save Settings” button to keep your favorite settings so that each time you
run the Fibonacci Market Scanner it will be just as you last saved it. You can
resave the settings as often as you like. Note that the data source is recalled
and brought back automatically. Your current chart view settings are also saved.
If you have modified your watch list of input symbols and returned to the Fibonacci Market Scanner to run a new scan without restarting the Fibonacci Market Scanner program, you will want to have The Fibonacci Market Scanner update or refresh its data before beginning the new scan. You can press this button any time a scan is not in process and the Fibonacci Market Scanner will get all new data from your data files.
When you check this box, The Fibonacci Market Scanner will show you the charts as they are found during the scan. This way you can begin looking at the charts immediately, without waiting for the scan to be completed. If you do not check this box, the scan will complete and the View Trend Lines button can be used to view the charts.
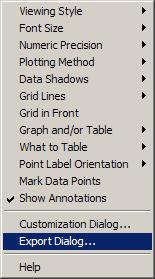
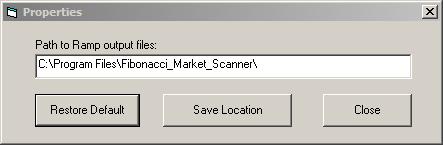
Where are the output files? The path to the output file directory is always displayed across the bottom of the Fibonacci Market Scanner main screen. You can change the default location if you choose. Under the “File” menu at the top left there is a menu item called “Output File Location”. When you click on this item, a window will appear that will let you edit the output directory path.
There are two files generated the first by the Fibonacci Market Scanner and the second by you. They are:
“Fibonacci_Symbol_List_One.txt” - All ticker symbols found by the Fibonacci Market Scanner during the scan.
“Fibonacci_Saved_Symbols.txt” - The symbols selected to save by you when you viewed the charts.
There are two files generated, the first by the Fibonacci Market Scanner, and the second by you. They are:
All ticker symbols found by the Fibonacci Market Scanner in the scan are in the text file:
“Fibonacci_Symbol_List_One.txt”
The symbols save by you when you viewed the charts are in the text file:
“Fibonacci_Saved_Symbols.txt”
You can select either file to import into a TC2000 watch list.
In TC2000, simply create a watch list to put them in such as one labeled “From Fibonacci Market Scanner”. In TC2000, go to this watch list and remove any existing symbols using the pull down menu “Watch List - Remove Symbols - All”. Then use the pull down menu, “Watch List - Import Symbols from List”. The TC2000 window shown below will appear.
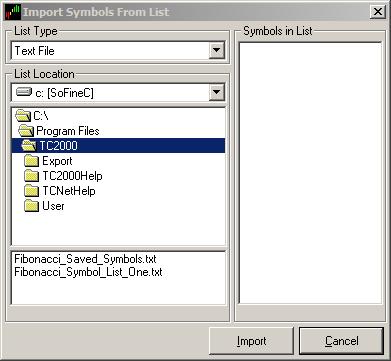
You will see the files in the
lower left window of the pop up view. Click on the file you want from the two
explained above and select OK. Your new watch list of stocks from the Fibonacci
Market Scanner is now complete and ready for you to view inside of TC2000.
Disclaimer
Nebadawn, Inc. assumes no responsibility for actions taken by any individual using the Fibonacci Market Scanner program to make investment decisions. Nebadawn, Inc. employees are not brokers or investment counselors and are not providing investment advice. The use of the Fibonacci Market Scanner program implies no claims, promises, or guarantees that any suggestion, system, trading strategy, or information will result in a profit, loss, or any other desired result. All users of the Fibonacci Market Scanner program assume all risk, including, but not limited to, the risk of losses.
Ramp Chart Pattern Recognition Scanner