Ramp
Bollinger Bands, Keltner Squeeze, and Detrended Price Oscillator Scanner
The image above shows an example setup screen for the Bollinger Bands Keltner Squeeze and Detrending Price Oscillator (DPO) Scanner.
In the example, three patterns were requested. If any of the three is found a chart will be created. Note that there is an entry for bars back. In this example, the number 5 will cause Ramp to look up to 5 bars back for any occurrence of any of the selected patterns.
You can scan for any of these chart patterns.
Bollinger Bands Top Touch Scanner
Bollinger Bands Top Breakout Scanner
Bollinger Bands Bottom Touch Scanner
Bollinger Bands Bottom Breakdown Scanner
Bollinger Bands Keltner Squeeze Scanner
Bollinger Bands Keltner Squeeze Top Breakout Scanner
Bollinger Bands Keltner Squeeze Bottom Breakdown Scanner
Detrending Price Oscillator Zero Crossing Up Scanner
Detrending Price Oscillator Zero Crossing Down Scanner
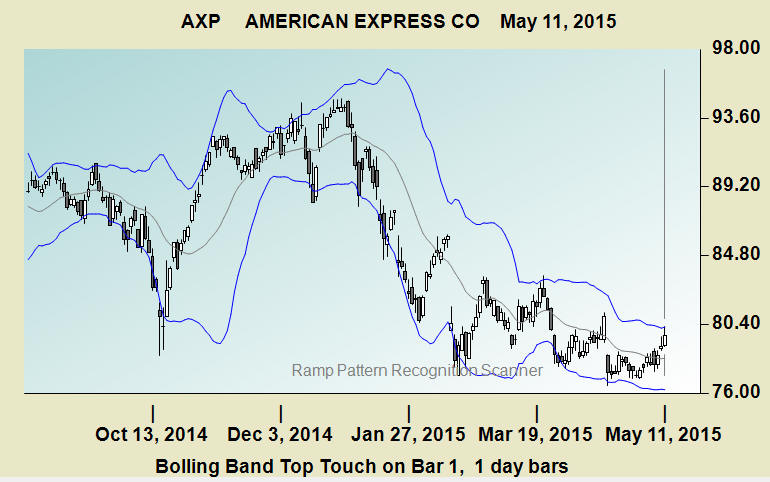
Below is an example image from a simple Bollinger Bands Top Touch scan.
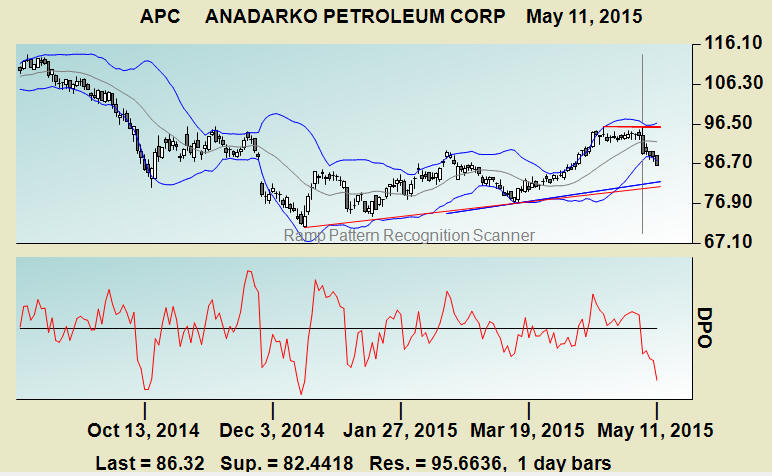
You can even have automatic trendlines drawn over your Bollinger Bands Scan results. Below is an example image from a Detrending Price Oscillator Scan where the DPO crossed below zero several days ago. The top window shows the Bollinger Bands with overlaid automatic trendlines. Note that the support and resistance levels are accurately displayed at the bottom of the chart.
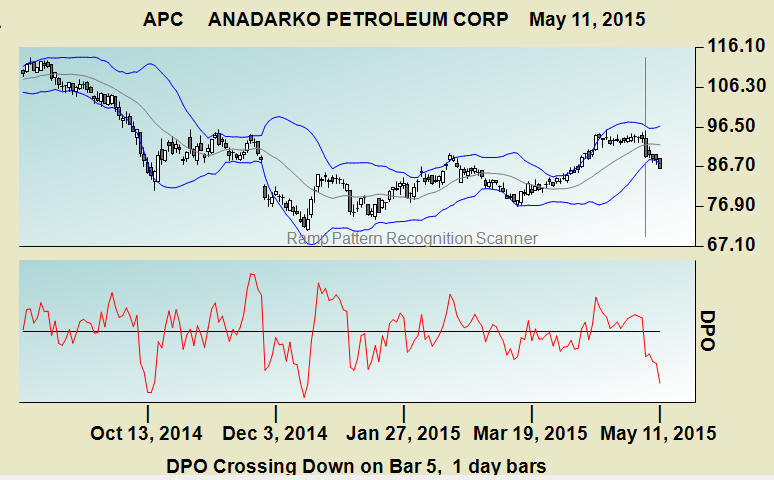
Below is the same image with the Auto Trendline feature not checked.
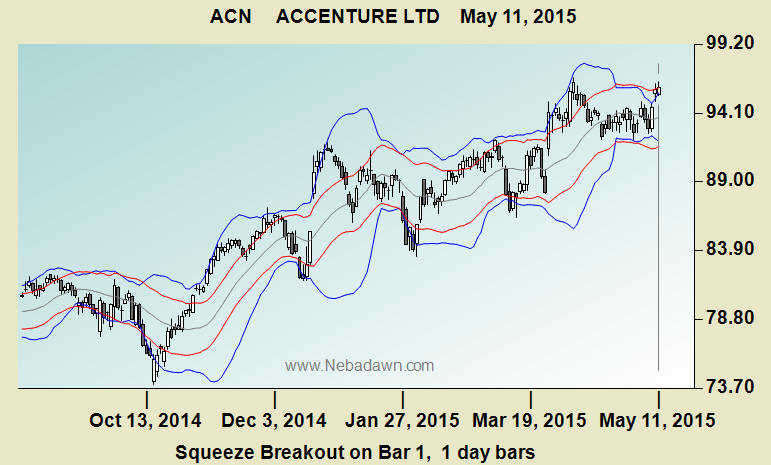
The chart below shows a Bollinger Bands Keltner Squeeze Breakout Scanner Image.
In the Ramp9 Program, just click on the "Select a Scan" button and select the Bollinger Bands, Keltner Squeeze and DPO Scanner as shown in the image below.
...
Click here to go to Nebadawn.com and install the Ramp program.