home
Ramp Aroon Lines Scanner
The image below shows the default Aroon Lines Scanner setup form.
Each setup option is explained below.
Number of bars to use in Aroon Line formula:
This is normally set to 25. The scanner will allow any value
between 3 and 100.
Search this many bars back to define the
pattern:
You can enter the number of bars back to search for the
patterns. As an example if you enter a 20 here Ramp will show you
all of the patterns that have occurred in the past 20 bars.
Show all charts:
You can check this box to see the Aroon Lines for every symbol in your
list od symbols to scan.
Find green lines crossing up through red
lines:
This is a bullish scan. Typically you would check this and scan
for several bars back to find charts beginning bullish moves. If
you check both crossing check boxes you will see both.
Find red lines crossing up through green
lines:
This is a bearish scan. Typically you would check this and scan
for several bars back to find charts beginning bearish moves. If
you check both crossing check boxes you will see both.
Aroon Line Levels:
The next check box will allow you to scan for red and/or green lines
crossing through any level. This includes the values 0 through
100.
Show Automatic Support and Resistance Lines Check Box
When you check this box Ramp will overlay automatic support and
resistance lines on the Price Bars.
Sample scan results can be seen below:
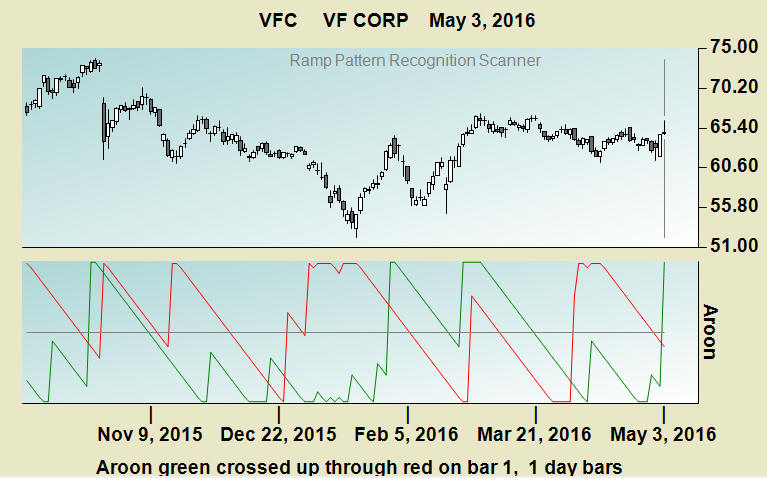
The image below shows an example of an Aroon green crossing up through an Aroon red.
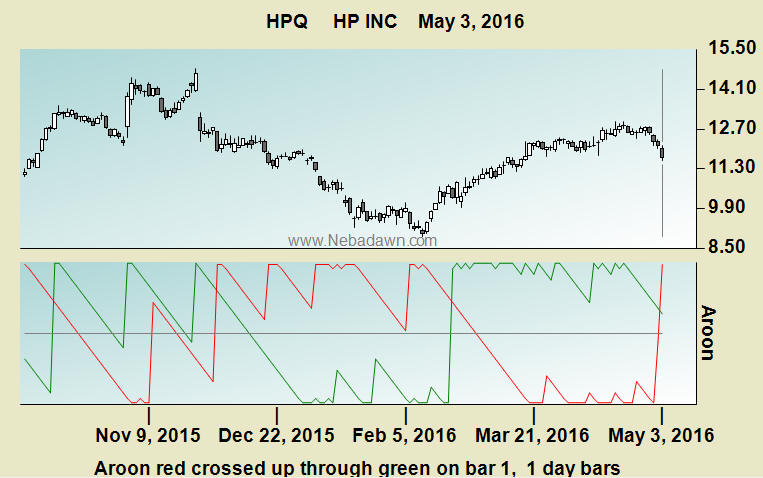
The image below shows an example of an Aroon red crossing up through an Aroon green.
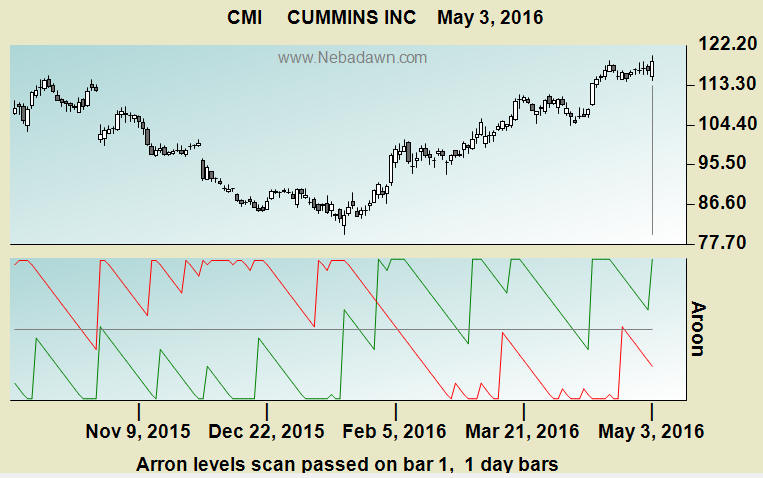
The chart below is an example of an Aroon green at 100 and Aroon red under 50.
To run a free trail of the Aroon Scanner install the free trial of Ramp at www.Nebadawn.com