Ramp Double Bottom and Top Scanner
for end of day and real time
Ramp Includes a Double Bottom and Top Scanner. It was designed by Bob Iaccino at http://www.marketmastersmember.com/. The code was written by Andy Skinner.
An image of the scanner input form is shown below.
Images from sample scan results are shown blow.
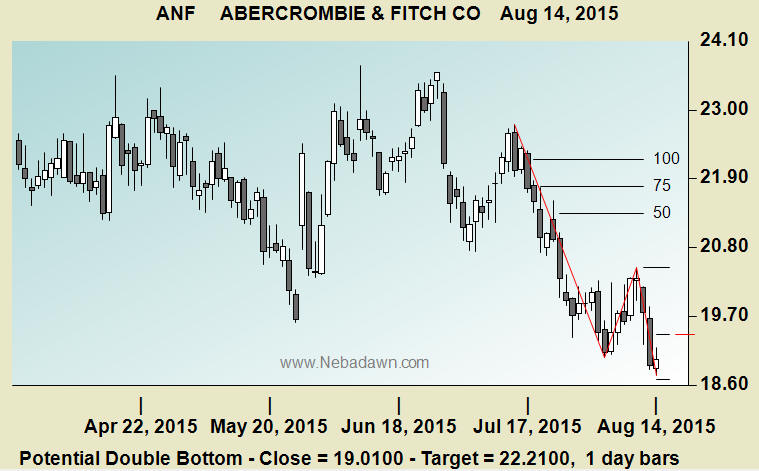
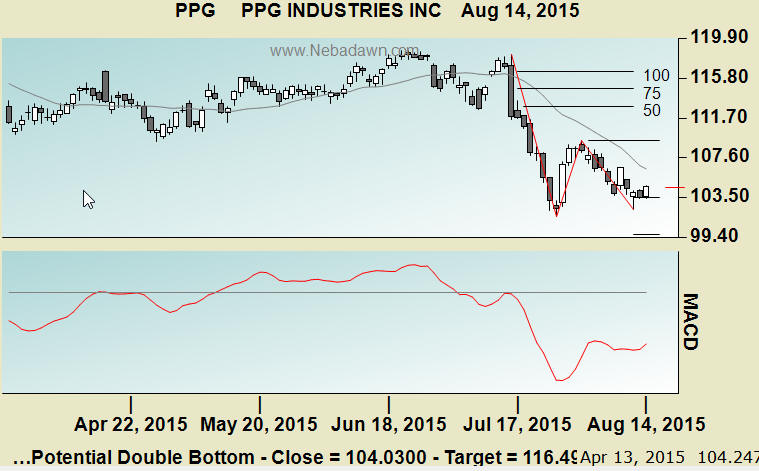
The image above shows a Potential Double Bottom Pattern. When accompanied by a strong MACD Divergence this is also known as an Early W Bottom. This scanner is very good at finding these setups.
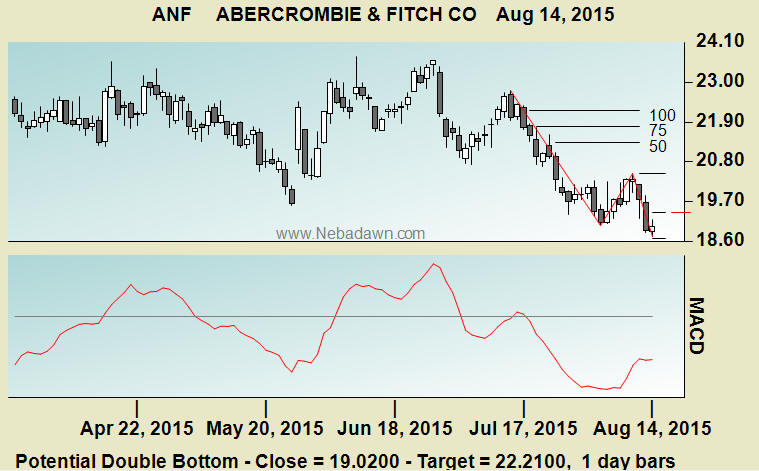
Above is the same image with the MACD line turned on. Note the confirming MACD Divergence.
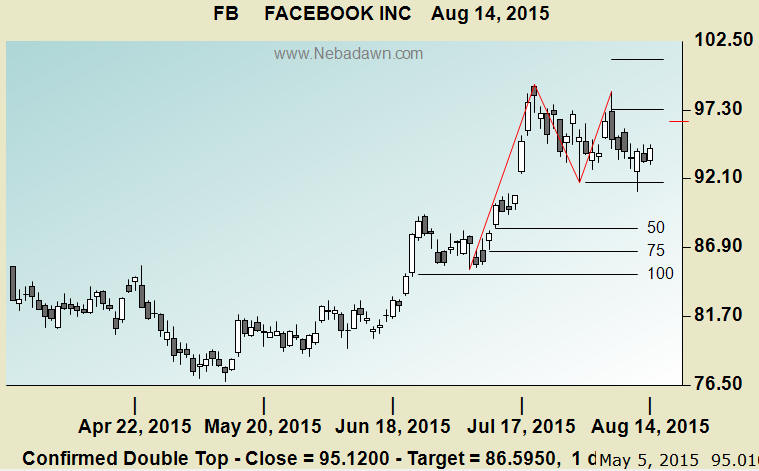
In the example above the double top has been confirmed because the price traded below the center of the Double Top formation.
Note that the image above has the following lines. They are all optional. For this example they have all been turned on.
Line Definitions
1.
Three red lines that form the first three legs of the W.
2.
A horizontal line at the center of the W.
3.
Three target lines at 50, 75 and 100 percent of the W third leg price change.
4.
Two horizontal lines at 75 and 125 percent retracement of the W leg 2. The leg 3 retracement must drop below the 75 and stay above the 125 percent retracement lines. This is adjustable.
5.
The small red horizontal line on the right axis is a stop level that can be used once the price has closed above the W center.
6.
There is an optional gray moving average line on the the price chart. This can be used for trading systems that require a moving average confirmation before entering a Double Bottom or Top trade.
7.
In the example the MACD chart has been turned on. This is also an option for trade setups that require a MACD divergence confirmation.
Control Settings.
Potential Bottom and Top Check Boxes
A potential double bottom or Top is one in which the last leg of the M or W has not yet formed. As long as the last leg has not crossed above the W center or below the M top it is considered potential. Checking these boxes will ask the scanner to show you these potential patterns. A potential W bottom with a strong MACD divergence has been referred to as an Early W Bottom in earlier versions of the Ramp Program.
Confirmed Bottom and Top Check Boxes
A pattern becomes a confirmed bottom or top when leg 4 trades (but does not close) above the W center or below the M center. You can ask the scanner to show you only confirmed patterns using these check boxes.
Triggered Bottoms and Top
A pattern becomes a triggered bottom or top when leg 4 closes above the W center or below the M center. You can ask the scanner to show you only triggered patterns using these check boxes.
Second Bottom or Top Retracement
This is the leg 3 price retracement requirement. The default is a 75 to 100 percent retracement of the price change in leg 2. You can adjust these values using the minimum and maximum text boxes.
Moving Average Requirement Settings
You can check this box to tell the scanner to require that the price has closed beyond a moving average line you specify. This applies to confirmed and triggered patterns only. Potential patterns don't use this feature because they are by definition potential.
MACD Divergence Requirement Settings
If you require a MACD divergence you can check this box and see only charts with good MACD divergences.
Show the Moving Average Line Checkbox
If you check this box a moving average line of your choice will be shown over the price bars.
Show the MACD Line Check Box
If you check this box you will see a lower chart with the MACD line. It is always just one single line. If you enter a third signal line value above 1 you will see the signal line. If you enter 1 for the last setting you will see the actual MACD line. A value of 1 should be used so that you see the MACD line rather than the signal line.
Show Pattern Lines Check Box
This will show you the red lines that define the first three legs of the pattern.
Show Price Reference Lines Check Box
The black horizontal price target lines are shown when this is checked. If you do not check this box the values are still used in the scan code but they are not shown on the chart.
Show a Stop Line
This will show you a short horizontal red line on the right axis. This is a logical stop to protect yourself after you entered the trade and the close has cleared the W or M center.
Show Automatic Support and Resistance Lines Check Box
When you check this box Ramp will overlay automatic support and resistance lines on the Price Bars.
More Trading Help
The Ramp 9 Double Bottom and Top Scanner input and setting options were designed by Bob Iaccino at http://www.marketmastersmember.com/. The scanner was written to compliment their Double Bottom and Top Trading System. We encourage you to visit http://www.marketmastersmember.com/ to learn more about Double Bottom and Top trading.