|
Ramp Home
Page Ramp Fibonacci Retracement Scanner Options The image below shows the options for the Ramp Fibonacci Scanner. End of day and intraday real time scanning. |
|
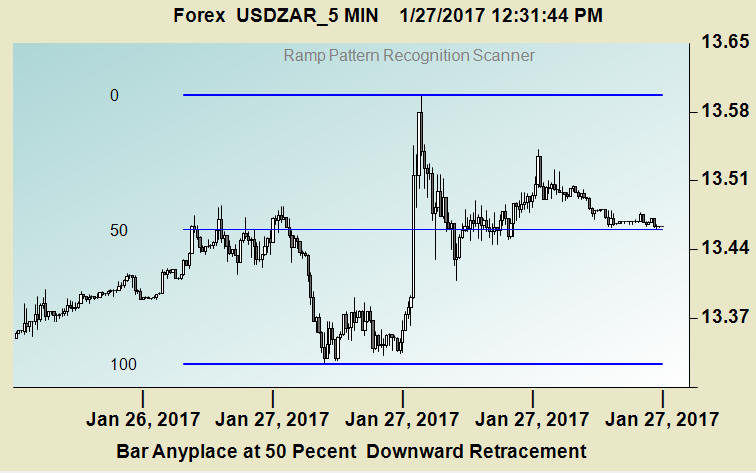
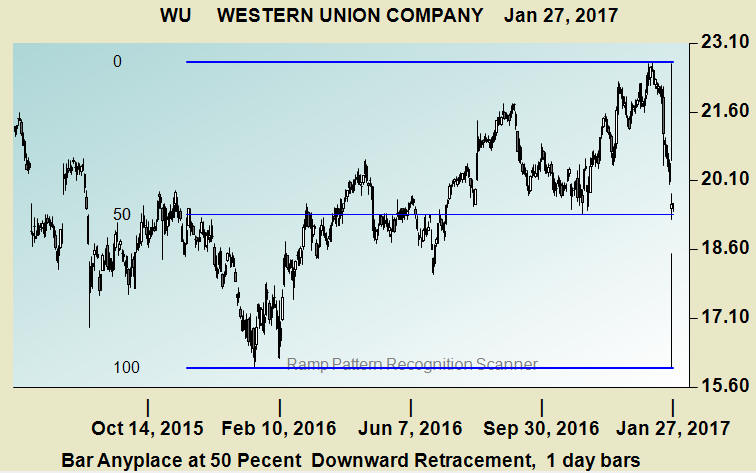
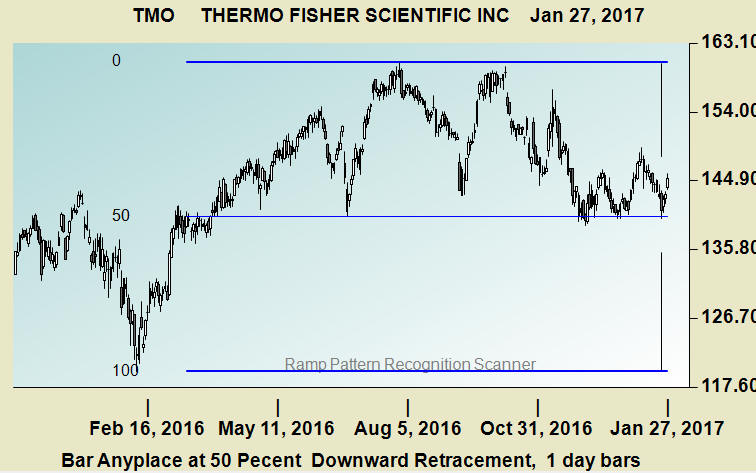
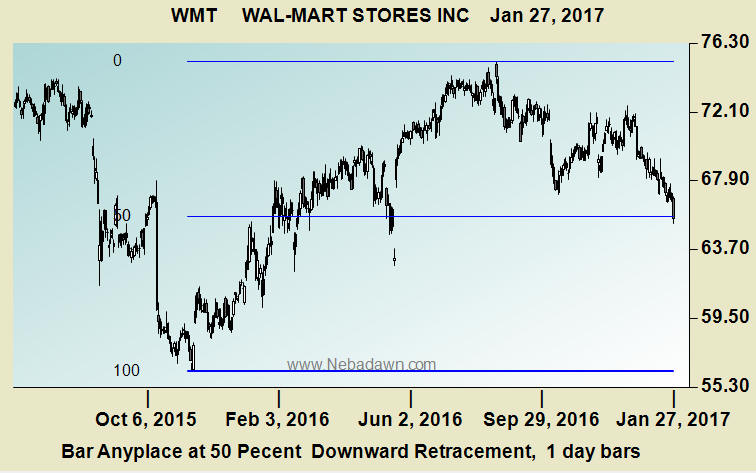
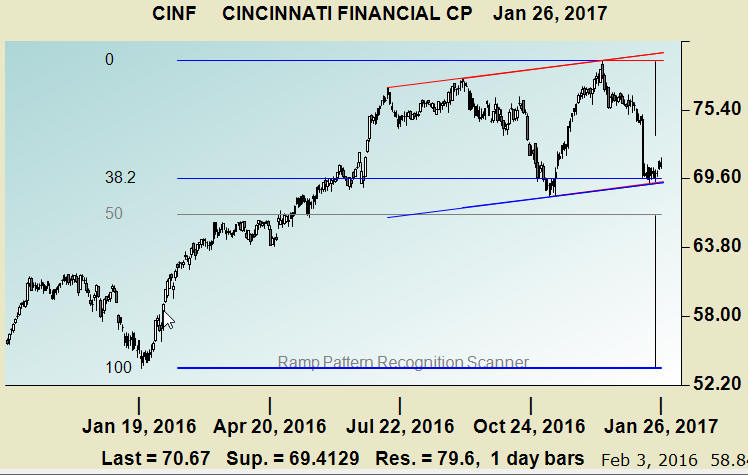
Each control is explained below Number of bars to look back to find the maximum high and lowest low. The Fibonacci scanner will look back this many bars to find the highest high and lowest low. The default is 2500 bars. You can make this smaller if you like but you may miss some important multi year levels. Don't be concerned because Ramp will automatically look at smaller patterns if no larger ones are found. Leave this at the default 2500 unless you really want to see only smaller patterns. % from line to be considered a touch You can adjust how close the price must be to a Fibonacci line to be considered a touch. This percent is based on %100 being a total move retracement. The default value is 1%. You can change this value if you want to make the scan more or less rigorous. If in doubt, just use the 1% default value. Search this many bars back to find the pattern. You can have the scanner look back several bars for a confirmed retracement. An example here might be if you have been gone for two days. You can enter a 3 and the scanner will test the last three days. The default value of 1 only considers the current bar. Use last week for max high and lowest low values check box. This check box uses only last weeks data to find the highest high and lowest low. When this box is checked the number of bars to look back is replaced with last weeks. Ignore the scan rules below and show all charts check box. This will ignore the selected scan rules and show you all charts. Scan Rules This will allow you to select up to 8 Fibonacci retracement levels for a single scan. If any rule is triggered a chart will pop up. In the example above 8 rules have been set up and the top 4 have been selected to be used. Show auto support and resistance levels check box. When this is checked automatic support and resistance lines are overlaid on all of the charts. Fibonacci Retracement Scanner Sample Images: |
|
Ramp Home
Page |