Fundamentals Scanner Help Page

| Home |
|
Ramp Fundamentals Scanner Help Page  |
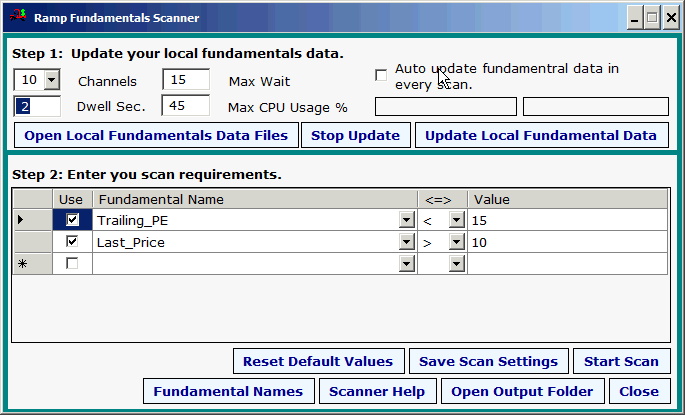
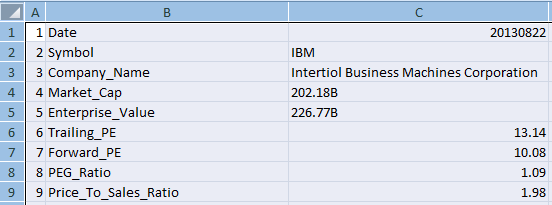
| Getting Started There are two steps to running a Fundamentals Scan. Step1 is to download the current fundamentals data for the symbols in your Symbols to Scan list. Step 2 is to design and run a scan on your new local fundamentals data. Whenever you change symbol lists you will want to rerun Step 1. If you are running a fixed list of symbols you can skip step 1 if you have recently done a download. It does not need to be re downloaded with every scan unless you change symbol lists. Below is a description of every control on the screen. Number of Channels You can open multiple channels to download data. As an example if you select 10 channels to download the 30 stocks in the DOW each channel will only need to download data for 3 symbols. This will greatly increase the speed of your download but it will put a bigger load on your computer. You will want to start with less than 10 channels and get a little experience with the data download. Channel Colors The data channel color turns yellow the moment the data request is sent to Yahoo Finance. The color turns green when the data is received successfully. Red means that there was a problem and the data was not correct or timed out. You can see a report on the symbols with bad results (red) in the Skipped-Symbols.csv file under the Open Local Fundamentals Data Files Button. Dwell Seconds This is the number of seconds to dwell between download request. Use a few seconds. If you hit Yahoo's server too hard and fast they can block your request as being abusive and you may be down for a few days. Just remember to respect their servers. Max Wait When a request is sent for data your PC will simply wait for the data to be returned. This is the maximum number of seconds the channel will wait for the data before it gives up and moves on to the next symbol. Try about 15 seconds. Max CPU Usage % The more channels you open the more CPU (computer processing resources) you are requesting. The program monitors your CPU usage percent and will wait to open another channel until the CPU usage falls below the percent you specify here. 45% is a good number to start with. You don't want to tie up your entire computer with too many channels requesting data. Notice that when you request 10 channels to download 30 symbols you may see a dwell before the next channel is opend. That is because your CPU usage jumped over the limit and the channel has to wait for the CPU percent to drop. You may also notice that some channels finish with all of the symbols before a new channel is even started. That is because the CPU was too busy to have them all open at one time. You can open your task manager and click on performance to watch the CPU usage during the download. Every computer and Internet connect is different so you may want to experiment with these settings to optimize it for your CPU, Internet speed and number of symbols. Auto Update Fundamental Data in Every Scan Leave this checkbox unchecked unless you have an automated process that runs while you are away. Downloading data with every scan is usually a waste of time and resources. Once the data for your symbol list is local a new download does no good. Update Local Fundamental Data Button This is the button you use to start the download. Once you have clicked this button, wait for the scan to finish. The flashing boxes will stop and say "Finished". Stop Update Button This will abort an update and close all channels immediately. If you do this you will have no local data to scan. Open Local Fundamentals Data Files Button This will open the downloaded data folder. The data is all in simple .csv files so that you can use them in any way you want. Even other programs. They are open able in any text editor or spread sheet. You will see the files in several formats as described below. Fundamental-Data.csv This is the raw data as it is returned from Yahoo Finance.  Note that it is not usable for scanning or sorting because it has non numeric data. The B in the image above means billions. The data must all be transformed to 100% numeric values before it can be used. All-Symbols.csv This is all of the data returned in a single spreadsheet. The data has all been transformed into numeric values for sorting and or any other calculation you need.  Note that there are 58 columns. One column for each scan able fundamental value. IBM.csv Each symbol also has its own file. In this case a different fundamental value is on each row.  The Scan Design Grid The Use Checkbox Column To tell the scanner to apply a fundamental rule check on the "Use" checkbox. If the box is not checked the rule will be ignored. The rules with the Use Checkbox checked will all be applied and only charts that meet all requested rules will be returned. Fundamental Name Column Click on the down arrow under the Fundamental Name column and select from any of the 59 fundamental parameters. <=> Column Pull down the <=> selection and select the desired comparison parameter. Value Column
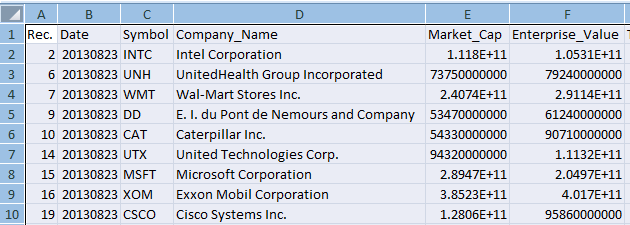
To Delete a Rule To delete a rule you can click on the gray box at the extreme left of the rule and press your Delete key. Scan Design Buttons Reset Default Values This button will reset all settings to the out of the box default settings. There is nothing really special about these values. They were simply used to test the system. Save Scan Settings This will save the current scan settings for your next run. All settings are sticky meaning that they will come back up the way you last set them as long as you click on the save scan setting button. Also note that you can save many different scans by scan names you assign. Do this under the "File" menu item on the Ramp 9 control screen. There is no limit to the number of predefined scan names you can use. Start Scan This will start a scan that applies your rules to the local fundamentals data. The result is a list of symbols that passed all rules. It is recorded several places. The list shows in the Ramp 9 main control screen. It is placed in the Ramp 9 Output folder with the name Fundamentals-Scan-Results.txt and it is placed in the Ramp 8 Symbol-Lists folder with the name Ramp9-Scan-Results.txt. This way you can use the results as the input symbols in Ramp 8. There is also a complete fundamentals spreadsheet created for the symbols that passed the scan. It is named Fundamentals-Scan-Results.csv and is the the Ramp9 Output folder. An image of that file is below. All 58 fundamental values are included for each symbol that passed the scan. You can open this file as a spread sheet.  Fundamental Names This link is a link to Yahoo Finance that will explain all of the fundamental value names used in this scanner. Scanner Help This button takes you to this help page on the web. Open Output Folder This button takes you to the Ramp 9 Output folder. All scan resultsa can be found as simple text and .csv files here. Close Closes the Fundamental scanner. The 58 Fundamentals values that the Ramp Fundamental Scanner can use in a scan. Yahoo Label Market Cap (intraday)5: Enterprise Value (Mar 23- 2012)3: Trailing P/E (ttm- intraday): Forward P/E (fye Dec 31- 2013)1: PEG Ratio (5 yr expected)1: Price/Sales (ttm): Price/Book (mrq): Enterprise Value/Revenue (ttm)3: Enterprise Value/EBITDA (ttm)6: Fiscal Year Ends: Most Recent Quarter (mrq): Profit Margin (ttm): Operating Margin (ttm): Return on Assets (ttm): Return on Equity (ttm): Revenue (ttm): Revenue Per Share (ttm): Qtrly Revenue Growth (yoy): Gross Profit (ttm): EBITDA (ttm)6: Net Income Avl to Common (ttm): Diluted EPS (ttm): Qtrly Earnings Growth (yoy): Total Cash (mrq): Total Cash Per Share (mrq): Total Debt (mrq): Total Debt/Equity (mrq): Current Ratio (mrq): Book Value Per Share (mrq): Operating Cash Flow (ttm): Levered Free Cash Flow (ttm): Beta: 52-Week Change3: S&P500 52-Week Change3: 52-Week High (Apr 8- 2011)3: 52-Week Low (Oct 4- 2011)3: 50-Day Moving Average3: 200-Day Moving Average3: Avg Vol (3 month)3: Avg Vol (10 day)3: Shares Outstanding5: Float: % Held by Insiders1: % Held by Institutions1: Shares Short (as of Feb 29- 2012)3: Short Ratio (as of Feb 29- 2012)3: Short % of Float (as of Feb 29- 2012)3: Shares Short (prior month)3: Forward Annual Dividend Rate4: Forward Annual Dividend Yield4: Trailing Annual Dividend Yield3: Trailing Annual Dividend Yield3: 5 Year Average Dividend Yield4: Payout Ratio4: Dividend Date3: Ex-Dividend Date4: Last Split Factor (new per old)2: Last Split Date3: LastP |
| Home |