Ramp 8
RSI Divergence Scanner
End of Day and Real Time Intraday
Control Screen:
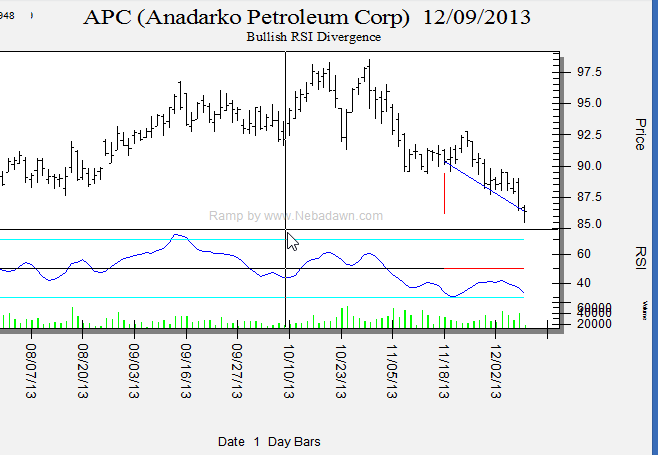
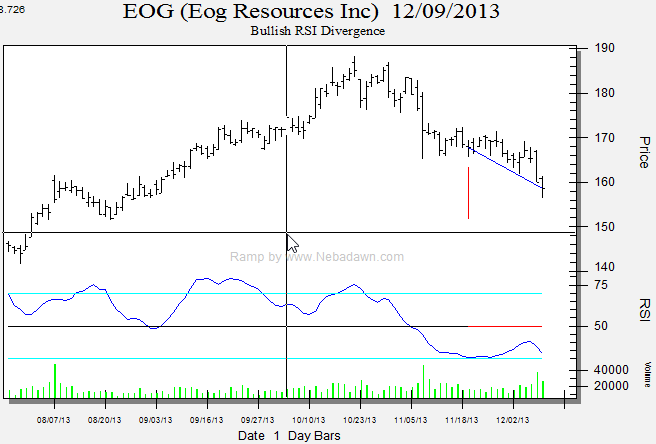
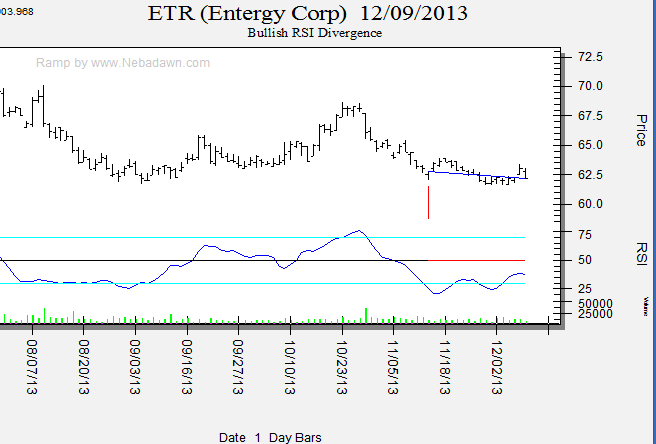
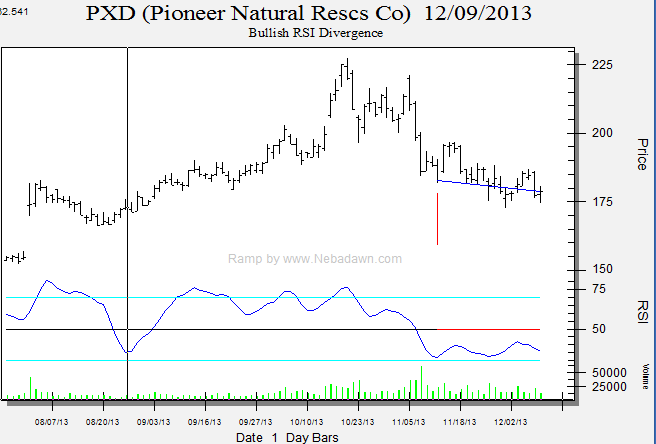
A typical RSI Divergence Scanner image is below.
Example Image Comments
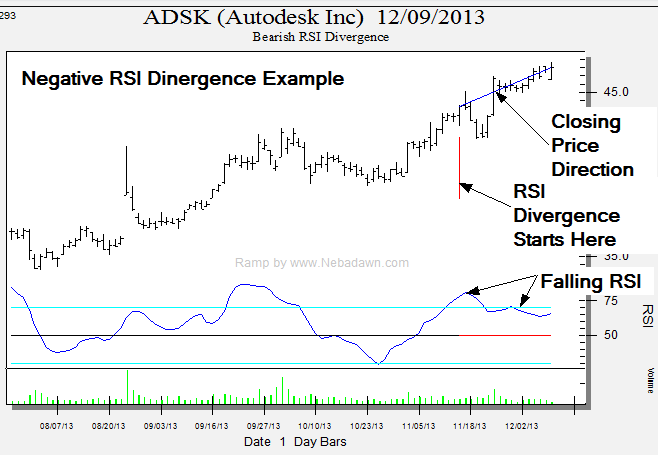
In the RSI divergence scanner example image above the "Closing Price Direction" text points to a black line that connects the closing price for the first bar in the divergence pattern with the current close.
A Red vertical line shows the first bar of the divergence pattern
Note the falling RSI as the price goes up.
Also note that the center line in the RSI chart turns red during the divergence.
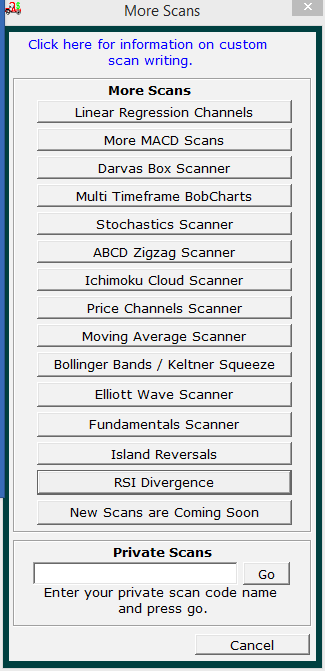
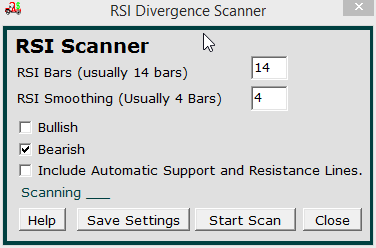
Each button and control on the screen is explained below.
RSI Bars (Usually 14) text box
You can enter the number of bars to be used in the RSI calculation here.
Most traders use a value of 14 bars but you can set it to any value you like.
RSI Smoothing (Usually 4 Bars) text box
The raw RSI line can be very jagged and many traders average the last few bars
to smooth it. 4 is the default value used by most traders.
Bullish Check Box
If you are looking for bullish RSI divergence setps you will want to check this box.
Bearish Check Box
If you are looking for bearish RSI divergence setps you will want to check this
box.
Include automatic support and resistance lines
If you check this box, fully automatic support and resistance lines will be
overlaid on your charts. The number of support and resistance lines shown
can be set under the BobCharts Button in the "Number of Lines to Show" combo
box.
Help Button
The Help button takes you to this web page.
Save Settings Button
This button will allow you to lock in your RSI Divergence Scanner options so
that when you run the scanner it will always come up with your pre selected
settings. You can even define custom scan names under the main
control screens "My Scans" menu item.
Start Scan Button
Click on this button to start a scan.
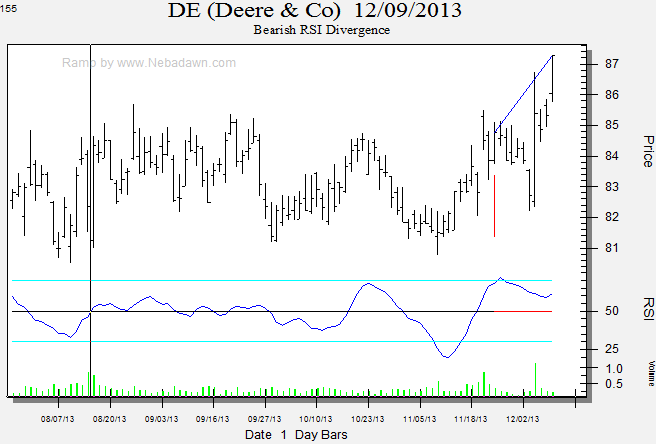
Below are example bullish and bearish RSI Divergence Scanner results.
